Free tools and guides

Cold calling statistics and parallel dialing data

Compare public findings on cold calling and parallel dialing. Each observation includes its source year and context. Use the figures to test a process, with the limits of each study in view.

Last reviewed: . Free to use. No signup required.

Read the denominator before the headline

This collection contains 30 sourced observations. Some concern cold calls. Others concern buyer surveys, longer sales calls, or inbound leads. They are labeled below. Source years are the report or original publication years, not a claim that every dataset was collected that year.

A connect rate divides answered calls by dials. A meeting rate may divide meetings by conversations. An email reply rate divides replies by emails. Compare like measures. The studies use different samples and do not establish a single US industry average.

Connect rates and prospecting outcomes

Check the denominator first. An answer per dial, a meeting per conversation, and a buyer's survey response describe different outcomes.

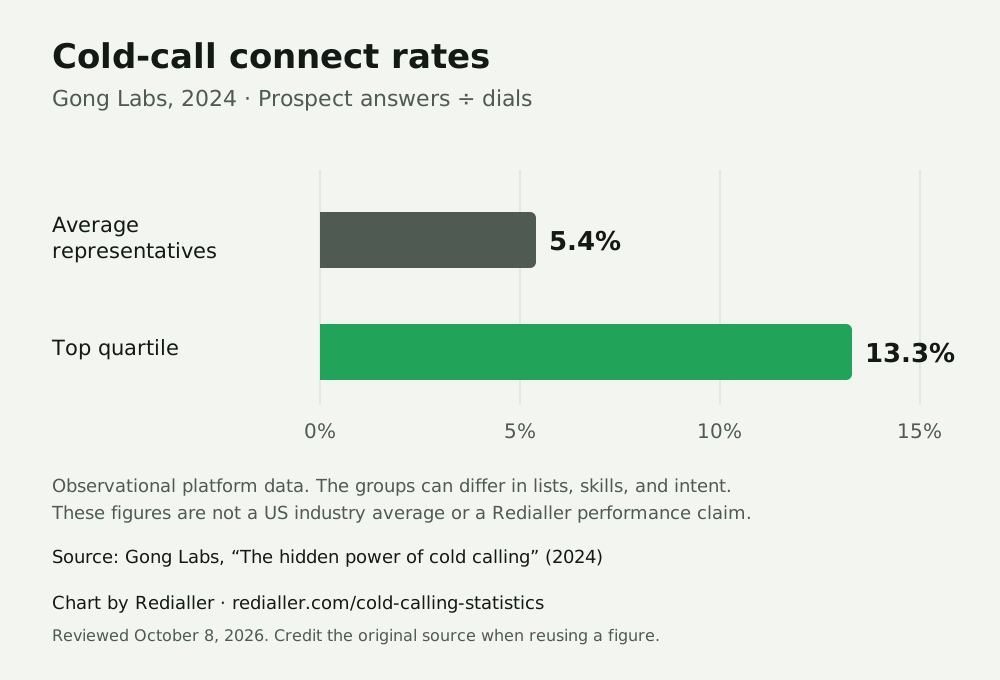
Cold-call connects in Gong's sample

5.4% / 13.3%

The average representative's connect rate was 5.4%; the top quartile's was 13.3%.

Prospect answers divided by dials. These cohorts are from Gong, not an industry-wide US benchmark.

Source: Gong Labs: The hidden power of cold calling (2024). Sample and limits.

Meetings from connected conversations

4.6% / 16.7%

Gong reported meeting rates of 4.6% for average representatives and 16.7% for top representatives.

Meetings divided by conversations. Do not compare this directly with an answer rate per dial.

Source: Gong Labs: The hidden power of cold calling (2024). Sample and limits.

WHAM meetings from conversations

4.82%

The 2024 report recorded 254 meetings from 5,265 conversations, with a published meeting rate of 4.82%.

This is the source's reported percentage. It is a conversation-to-meeting metric, not the chance that any dial books a meeting.

Source: Cognism and WHAM: State of Cold Calling 2024 (2024). Sample and limits.

Connected dials in the 2024 report

9,247 / 55,701

The report states that 9,247 of 55,701 dials connected.

Raw numerator and denominator are preserved. The report's connected-call sample differs from its meeting-conversion sample.

Source: Cognism and WHAM: State of Cold Calling 2024 (2024). Sample and limits.

Buyers who responded favorably to a new seller

77%

77% of buyers reported responding favorably to a new seller who reached out in the previous 12 months.

Outreach across channels. A favorable response does not necessarily mean a booked meeting or a purchase.

Source: RAIN Group: Top Performance in Sales Prospecting (2018). Sample and limits.

Quality conversations per SDR per day

3.6

The Bridge Group reported an average of 3.6 quality conversations per representative per day.

A quality conversation is a connect or response that yields at least one piece of qualifying or disqualifying information. This includes channels other than phone.

Source: The Bridge Group: 2023 Sales Development Report (2023). Sample and limits.

Daily quality conversations by dominant channel

4.1 / 2.9 / 3.9

The report's chart gives 4.1 quality conversations per day for phone-centric groups, 2.9 for email-centric groups, and 3.9 for neutral groups.

Groups were classified by their dominant outreach channel. Quality conversations can include non-phone responses. This survey association does not establish that switching channels causes an increase.

Source: The Bridge Group: 2023 Sales Development Report (2023). Sample and limits.
Best times, buying stages, and repeat touches

Timing depends on the buyer and the outcome measured. The 2025 WHAM report identifies Tuesday for the most meeting bookings. It does not publish enough detail to turn that observation into a universal day-of-week rule.

The Tuesday observation comes from Cognism and WHAM's 2025 report. Check the recipient's location and allowed calling window before testing a time block.

When buyers want to hear from sellers

71% / 62%

71% wanted to hear from sellers while looking for new ideas; 62% while actively looking for a solution to a problem.

Buying stages, not hours of the day. Answers can overlap; do not add the percentages.

Source: RAIN Group: Top Performance in Sales Prospecting (2018). Sample and limits.

Touches to generate a meeting or conversation

5 / 8

RAIN Group reported an average of five touches for top performers and eight for the rest to generate a meeting or other conversation.

Touches combine outreach channels. These figures are not a required number of repeat phone calls.

Source: RAIN Group: Top Performance in Sales Prospecting (2018). Sample and limits.

Longest calls in WHAM's 2025 data

10–11 a.m.

The report identifies 10–11 a.m. as its longest-call window, followed by 2–3 p.m.

The outcome is call length, not connect rate or meeting rate. The report does not specify a time-zone convention, so this is a test hypothesis, not a universal local-time recommendation.

Source: Cognism and WHAM: State of Cold Calling 2025 (2025). Sample and limits.

Talk time and conversation quality

Longer sales calls and short cold calls need separate benchmarks. Talk patterns can reflect buyer interest. These studies do not show that changing a timer or talk ratio causes a result.

Average call length in the WHAM reports

83 / around 93 seconds

The 2024 report gives 83 seconds. The 2025 report describes an average of around 93 seconds.

Source wording and precision are preserved. The yearly cohorts differ; the comparison does not prove a market-wide increase.

Source: Cognism and WHAM: State of Cold Calling 2025 (2025). Sample and limits.

Representative talk share on successful cold calls

55%

Gong reported that representatives spoke for 55% of the time on successful cold calls.

Historical cold-call observations. This does not apply to every discovery call or establish a target talk share.

Source: Gong Labs: Cold call stats (2021). Sample and limits.

Representative monologues by cold-call outcome

53 / 25 seconds

Average monologues were 53 seconds on successful cold calls and 25 seconds on unsuccessful calls.

Use the source's seconds, not its inconsistent headline percentage. Longer monologues can be an effect of buyer interest rather than its cause.

Source: Gong Labs: Cold call stats (2021). Sample and limits.

Prospect monologues by cold-call outcome

3.5 / 8 seconds

Average uninterrupted prospect speech was 3.5 seconds on successful cold calls and eight seconds on unsuccessful calls.

A historical observation, not a recommendation to interrupt prospects. Subgroup sizes are not provided.

Source: Gong Labs: Essential cold calling tips (2018). Sample and limits.

Speaker changes on successful cold calls

77% more

Successful cold calls had 77% more speaker switches per minute than unsuccessful calls.

A comparison of conversation patterns. The article does not establish that increasing turn-taking causes a meeting.

Source: Gong Labs: Essential cold calling tips (2018). Sample and limits.

Average talk share on longer sales calls

60% / 40%

In Gong's 2025 sample, representatives talked for 60% of the time and listened for 40%.

The sample contains only sales calls lasting at least 10 minutes. Keep it separate from short cold calls.

Source: Gong Labs: Talk-to-listen conversion ratio (2025). Sample and limits.

Talk share by deal outcome

57% / 62%

Representative talk share was 57% in closed-won deals and 62% in lost deals.

Longer sales calls, not cold calls. The five-percentage-point difference is an association, not evidence that a talk ratio determines a deal outcome.

Source: Gong Labs: Talk-to-listen conversion ratio (2025). Sample and limits.

Insight-oriented sellers and prospecting success

3×

Insight-oriented sellers were three times more likely to report prospecting success.

A survey association with self-reported success across prospecting channels. It is not a measured tripling of cold-call meetings.

Source: RAIN Group: Top Performance in Sales Prospecting (2018). Sample and limits.

Voicemail and follow-up email

The verified Gong figures measure email replies after voicemail activity. They do not measure how often prospects call back.

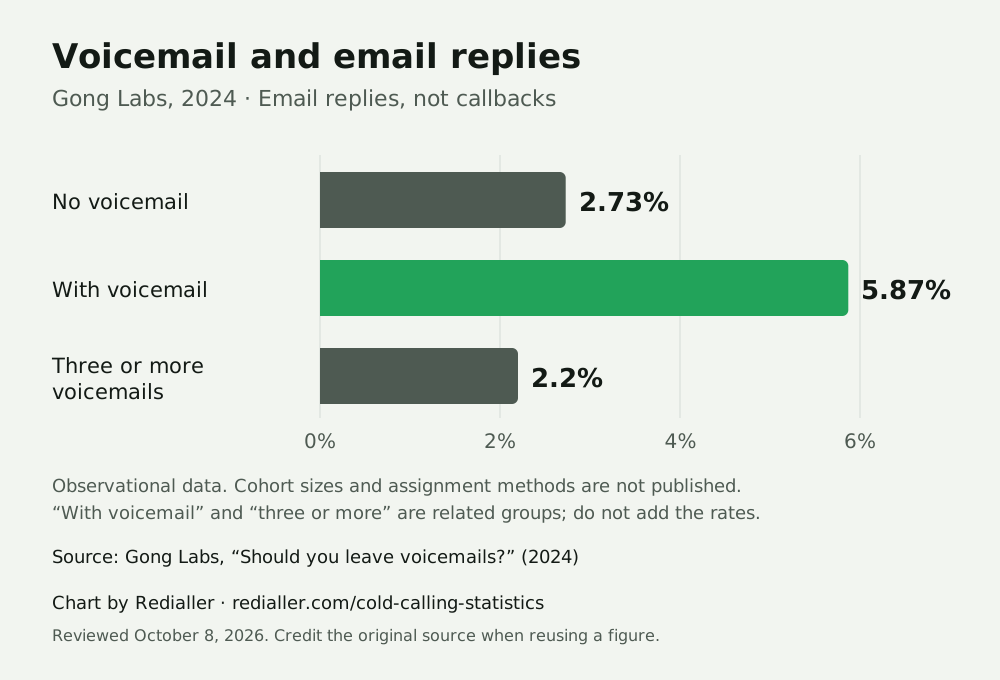
Email replies associated with voicemail

2.73% / 5.87%

Gong reported a 2.73% email reply rate without voicemail and 5.87% with voicemail.

Email replies, not calls returned. These cohorts were not shown to be randomly assigned.

Source: Gong Labs: Should you leave voicemails? (2024). Sample and limits.

Email replies after three or more voicemails

2.2%

The email reply rate associated with three or more voicemails was 2.2%.

The same source reports a 2.73% no-voicemail baseline. The observation does not prove a universal limit on voicemail attempts.

Source: Gong Labs: Should you leave voicemails? (2024). Sample and limits.

Speed to lead: historical inbound evidence

The HBR research concerns people who submitted an online inquiry. It gives useful historical evidence for inbound routing, but it cannot establish a conversion rate for unsolicited outbound calls.

Response times in a US company audit

37% / 16% / 24% / 23%

37% responded within an hour, 16% in one to 24 hours, 24% after 24 hours, and 23% never responded.

The 2011 audit sent web-generated test leads to 2,241 US companies. These are company response shares, not call-conversion rates.

Source: Oldroyd, McElheran and Elkington: The Short Life of Online Sales Leads (2011). Sample and limits.

Early response and incoming-lead qualification

Nearly 7× / more than 60×

Contact within an hour was associated with nearly seven times the likelihood of qualification versus an hour later, and more than 60 times versus waiting 24 hours or longer.

A separate study of 1.25 million incoming leads at 29 B2C and 13 B2B US companies. Qualification meant a meaningful conversation with a key decision maker, not a sale. This is an observational finding.

Source: Oldroyd, McElheran and Elkington: The Short Life of Online Sales Leads (2011). Sample and limits.

Parallel dialing and power dialing

Mode comparisons depend on list quality, persona, and intent. Orum's platform data describes its sample. It does not predict Redialler results or prove that one mode works best for every team.

Meetings per hour by dialing mode and role

0.88 / 0.62

For individual contributors, Orum reported 0.88 meetings per hour in parallel mode versus 0.62 in power mode. Managers were 0.69 versus 0.53.

Weighted platform observations. A counterexample: IT individual contributors were 0.678 in parallel and 0.768 in power. Different lists and intent can explain differences; this is not a Redialler performance claim.

Source: Orum: When to power dial and when to parallel dial (2025). Sample and limits.

Meetings per connection by dialing mode

About 6.4% / 3.8%

Orum reported about 6.4% meetings per connection in power mode and about 3.8% in parallel mode.

The source gives approximate values. Connections, not dials, are the denominator. Mode assignment and list selection were not randomized.

Source: Orum: When to power dial and when to parallel dial (2025). Sample and limits.

Bridged conversation length for Admin personas

Roughly 9–11 / 4–5 minutes

Admin-persona conversations averaged roughly nine to 11 bridged minutes in power mode and about four to five in parallel mode.

Preserves the source's approximate ranges. These are persona-specific averages, not duration targets or a guarantee that power mode creates longer conversations.

Source: Orum: When to power dial and when to parallel dial (2025). Sample and limits.

Reported power and parallel dialer adoption

43% / 31%

43% of survey respondents reported power dialer use and 31% reported parallel dialer use.

Multiple selections were allowed. The same survey lists 56% using a CRM or sales-engagement dialer and 43% dialing manually; adoption shares must not be added together.

Source: Orum: 2024 State of Sales Development (2024). Sample and limits.

Compliance: legal thresholds, separate from statistics

These are selected federal rule thresholds. They are excluded from the observation count. Scope, exceptions, and stricter state rules matter. This is not legal advice. Use the TCPA checklist to review a calling process with counsel.

Selected provisions of 47 CFR § 64.1200. Reviewed October 8, 2026.
RuleThresholdScope and official source
Residential telephone solicitation window8 a.m.–9 p.m.The recipient's local time applies to covered residential telephone solicitations. State law can impose a narrower window. This is not a general exemption for all B2B calls. 47 CFR § 64.1200(c)(1).
Unanswered telemarketing callAt least 15 seconds or 4 ringsThe regulation prohibits disconnecting a covered unanswered telemarketing call before this minimum. This is a legal threshold, not advice to force a prospect to stay on a call. 47 CFR § 64.1200(a)(6).
Live-answer abandonment limit3% over 30 daysThe denominator is telemarketing calls answered live by a person, measured for one campaign over the specified period. Connection timing, message, records, and other conditions also apply; meeting the percentage alone does not establish compliance. 47 CFR § 64.1200(a)(7).
National DNC safe-harbor registry ageNo more than 31 daysOne condition of the cited safe harbor is a process that uses a National Do Not Call Registry version obtained no more than 31 days before the call. Training, procedures, records, and other conditions also apply. 47 CFR § 64.1200(c)(2)(i)(D).

Download charts with the source attached

Each chart preserves the published percentages. The bars start at zero. The comparison shows an association in Gong's sample. It does not show a guaranteed result or a causal effect.

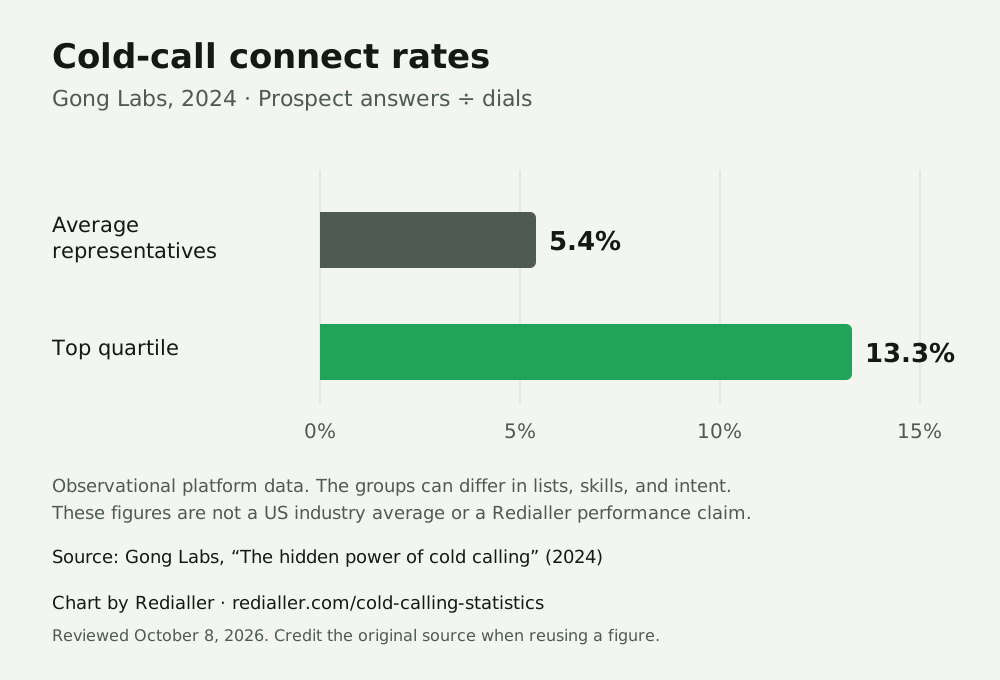
Gong 2024 cold-call connect rates: average representatives 5.4%, top quartile 13.3%. Prospect answers divided by dials.
Gong Labs, 2024. Original source. Download connect-rate chart (SVG).
Connect-rate chart data
CohortPublished rate
Average representatives5.4%
Top quartile13.3%
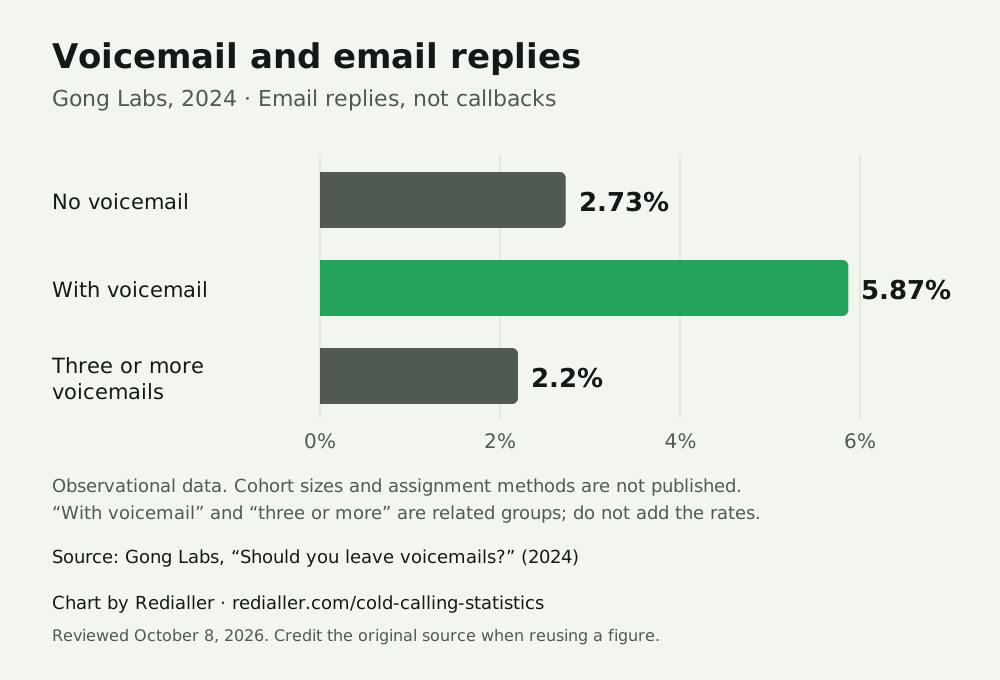
Gong 2024 email reply rates: no voicemail 2.73%, with voicemail 5.87%, three or more voicemails 2.2%. These are email replies, not callbacks.
Gong Labs, 2024. Original source. Download voicemail chart (SVG).
Email-reply chart data
CohortPublished rate
No voicemail2.73%
With voicemail5.87%
Three or more voicemails2.2%

Sources and study limits

All included sources were opened for this review. A later page update does not change an older study's date. The source can change after this review. Keep the source name, year, and definition beside a figure when you cite it.

Gong Labs: The hidden power of cold calling (2024)

Gong describes an analysis of 300M+ cold calls. Connect rate means calls answered by a prospect divided by dials; meeting rate means meetings divided by conversations.

Limits: Vendor platform data. The article does not publish cohort sizes, collection dates, geography, or a randomized comparison.

Gong Labs: Should you leave voicemails? (2024)

Gong's 300M-call research series compares email replies associated with voicemail activity.

Limits: These are email reply rates, not callback rates. Cohort sizes and assignment methods are not disclosed. Association does not prove that voicemail caused a reply.

Gong Labs: Essential cold calling tips (2018)

The original article reports a dataset of 90,380 cold calls and compares calls that did and did not book a meeting.

Limits: Historical vendor observations. The article does not give subgroup sizes or collection dates. Its later page update does not make the underlying dataset new.

Gong Labs: Cold call stats (2021)

Gong says it analyzed thousands of cold calls; successful calls are discussed in the context of meetings booked.

Limits: Exact sample size and collection period are not stated. This is an association between call behavior and an outcome, not a script or duration experiment.

Gong Labs: Talk-to-listen conversion ratio (2025)

326K sales calls lasting at least 10 minutes, between representatives and potential customers.

Limits: These are longer sales calls, not a cold-call sample. Deal outcomes and performance groups are observational; results do not establish a target talk ratio.

Cognism and WHAM: State of Cold Calling 2024 (2024)

Cognism and We Have A Meeting describe 10,000 cold calls, a 55,701-dial connection sample, and a 5,265-conversation meeting sample.

Limits: The report uses different samples for different metrics. The cohorts are not a representative survey of all US sales teams.

Cognism and WHAM: State of Cold Calling 2025 (2025)

WHAM call data reported by Cognism, with a separate discussion of Cognism's own sales team.

Limits: Some charts do not state their subgroup denominators. Time-of-day results use call length, not meeting conversion. The time-zone convention is not disclosed.

RAIN Group: Top Performance in Sales Prospecting (2018)

Survey of 488 B2B buyers and 489 sellers. Figures are in RAIN Group's publicly linked infographic and PDF, published in 2018.

Limits: Self-reported prospecting behavior, across channels. Publication year is shown; collection dates and question-level sample sizes are not supplied in the infographic.

The Bridge Group: 2023 Sales Development Report (2023)

365 executives at B2B companies; 69% North America-based and 21% global companies. Pages 26–28 cover activity and quality conversations.

Limits: Survey responses, not call recordings. A quality conversation can be a connect or a response on another channel, so it is not a phone-only metric.

Oldroyd, McElheran and Elkington: The Short Life of Online Sales Leads (2011)

An audit of 2,241 US companies, plus a separate study of 1.25 million incoming leads at 29 B2C and 13 B2B US companies.

Limits: Historical inbound web leads, not unsolicited cold calls. Qualification meant a meaningful conversation with a key decision maker. Figures are available in the publisher's public Article structured data; reading the full article may require a subscription.

Orum: When to power dial and when to parallel dial (2025)

Follow-up to Orum's State of Cold Calling report, described as over one billion outbound dials across more than eight million verified job titles.

Limits: Orum platform data, weighted by activity. Dialing mode was not randomly assigned. List quality, persona, and intent can differ between modes. The article does not publish subgroup counts or a reproducible definition of the hour denominator.

Orum: 2024 State of Sales Development (2024)

Sales-development survey. Page 12 asks which calling technologies teams use and permits multiple answers.

Limits: The public PDF does not state the respondent count or a full sampling method. These are reported tool-adoption shares, not dialing performance.

Cite this page

Redialler. Cold calling statistics and parallel dialing data. Reviewed October 8, 2026. https://redialler.com/cold-calling-statistics.

For a numerical claim, also cite the original source and its year. For example: Gong Labs (2024), prospect answers divided by dials, 5.4% for average representatives and 13.3% for the top quartile; chart compiled by Redialler.

Frequently asked questions

What is a good cold-call connect rate?

There is no universal rate in these sources. Gong's 2024 analysis reports a 5.4% average and 13.3% for top-quartile representatives in its sample. Track answers divided by dials for your own lists, and keep that separate from meetings divided by conversations.

Do these statistics prove that parallel dialing works better?

No. Orum's observations compare its platform cohorts. Power mode had higher meetings per connection, while parallel mode had higher meetings per hour in several roles. Lists, personas, and intent can differ between modes. These data do not predict Redialler results.

Does leaving a voicemail increase callbacks?

The verified Gong study measures email reply rates, not callbacks. It reports 2.73% without voicemail and 5.87% with voicemail. The study does not show that voicemail itself caused the difference.

Do speed-to-lead findings apply to cold calls?

The cited HBR research concerns inbound online inquiries in 2011. Qualification meant a meaningful conversation with a key decision maker. It does not establish an outbound cold-call conversion rate.

Can I cite these statistics or reuse the charts?

Yes. Credit the original study, give its year, and include its denominator and limits. Credit Redialler for the chart or compilation and link to this page. Do not describe a vendor sample as an industry-wide benchmark.

Keep your calling work in Attio.

Set up your calling workspace in minutes. Questions about your CRM or team? Talk to us before you start.